U.S. and Canadian financial marketers still face a common challenge: understanding what a competitive affiliate CPA looks like in today’s market.
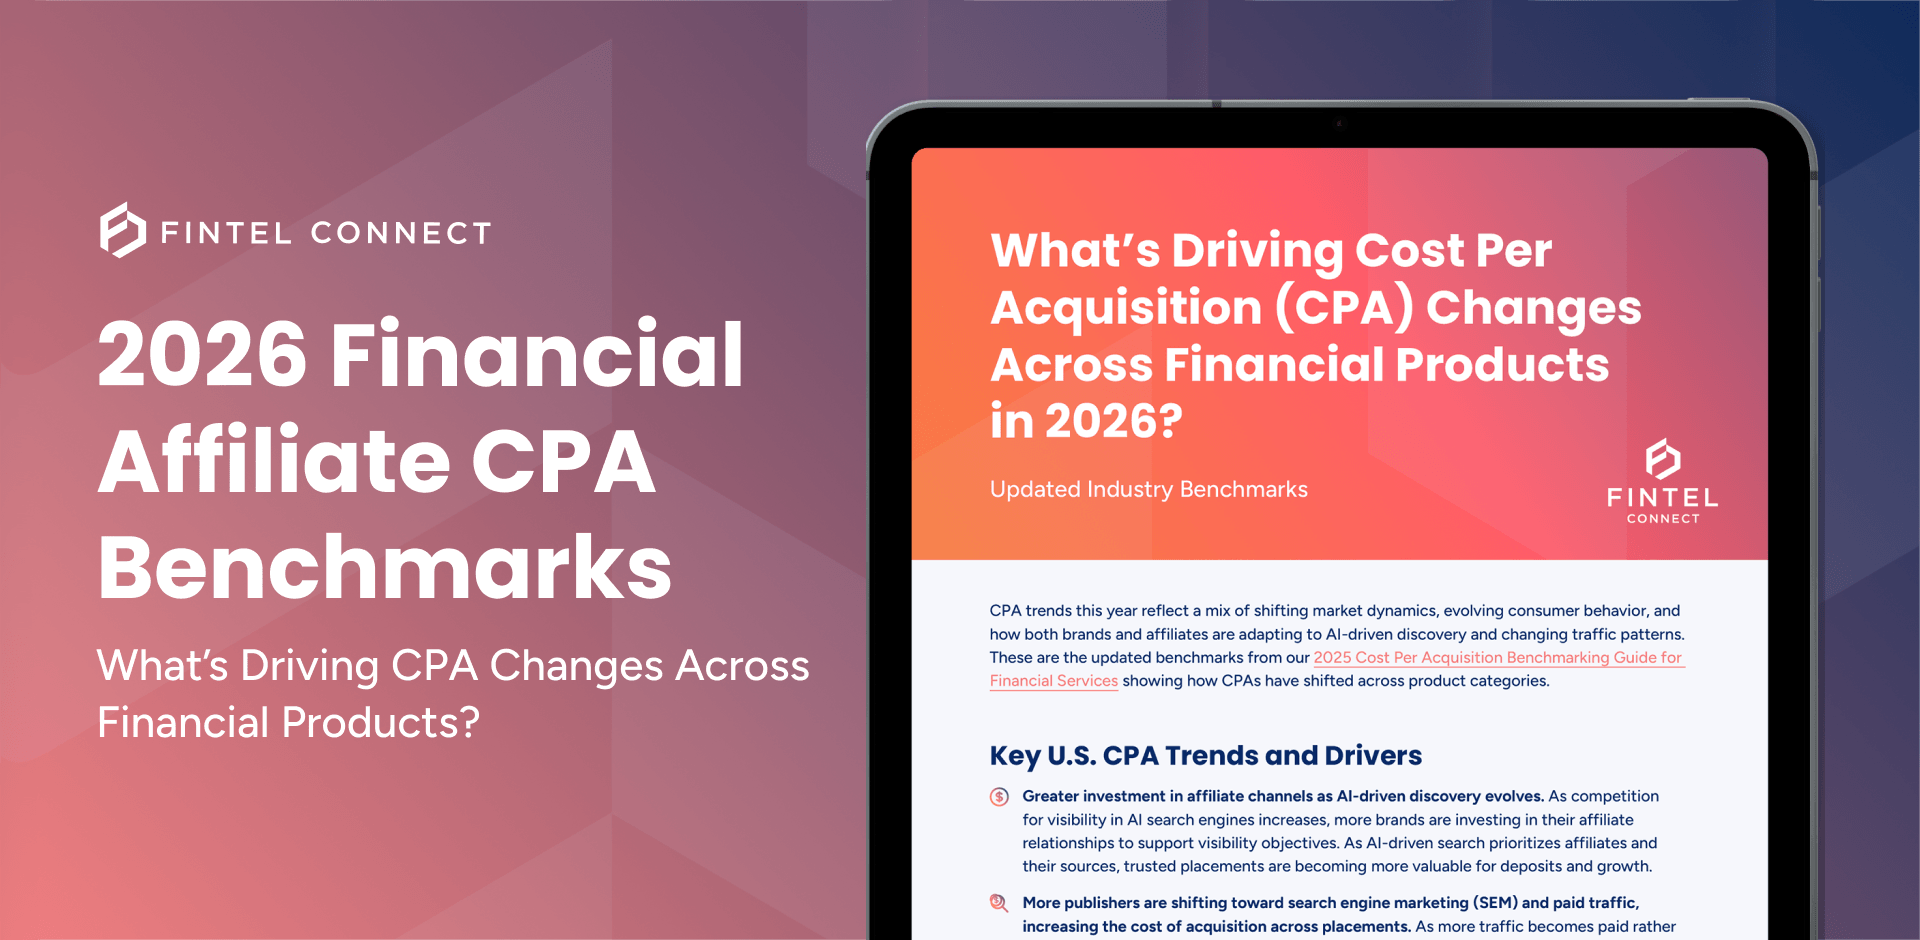
Our 2026 Financial Affiliate CPA Benchmark cheatsheet gives you a current snapshot of how CPAs are trending across key financial product categories, ahead of the more comprehensive benchmark report coming in Q3.
What’s Driving CPA Changes Across Financial Products?
Drawing from campaign insights across banks, credit unions, and fintechs, our updated benchmarks show how CPAs have shifted across the U.S. and Canada in banking, investing, lending, insurance, and business product categories.
This year’s benchmarks reflect:
- Changing market dynamics
- Evolving consumer behavior
- How brands and publisher partners are adapting to AI-driven discovery and new traffic patterns
Updated from our 2025 Cost Per Acquisition Benchmarking Guide for Financial Services, this snapshot shows where costs are rising, stabilizing, and why.
Who This Is For
Senior financial marketing leaders and teams evaluating affiliate CPA competitiveness, payout strategy, partner mix, and growth opportunities.
Why Financial Affiliate CPA Benchmarks Matter
Strong performance isn’t only about hitting targets. It’s also about understanding how your affiliate campaigns compare with broader market conditions.
Benchmark data gives teams a clearer foundation for payout, placement, and partner decisions, while helping make acquisition planning more defensible as costs and traffic patterns shift.
With that context, teams can better assess:
- Whether current results reflect efficiency or untapped opportunity
- Which products or partner types may need a different CPA approach



 English
  Français